Posts tagged Cacti
External server monitoring with Panopta
One of the most important things when you’re running a hosting business, is keeping an eye on your infrastructure so you can be on top of any faults that might arise.
At Web In A Box, we run our own internal monitoring using cacti+nagios which keeps an eye on all our stuff.
The problem with running internal monitoring is, it’s not really done from a customer’s perspective– if there’s an upstream fault which would cause your customers problems, your monitoring won’t always catch it.
To combat this, we signed up for a monitoring service from a company called Panopta (http://www.panopta.com). Panopta has a network of monitoring nodes all around the world (20, at last count). You select your primary monitoring point (in our case, Sydney) and Panopta probes the services within your network every 60 seconds.
In the event of a failure, the other monitoring nodes will start actively checking, which means it lowers false positives, while allowing you to gain a bit more perspective on faults, allowing you pin-point geographically where the fault may lie, if it’s upstream.
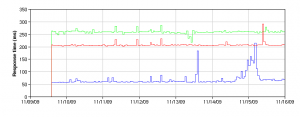
Panopta also keep historic trending data and also allow you to have a public facing availability report:
So if you’re looking for a decent way to keep an eye on your network, give Panopta a look 🙂

